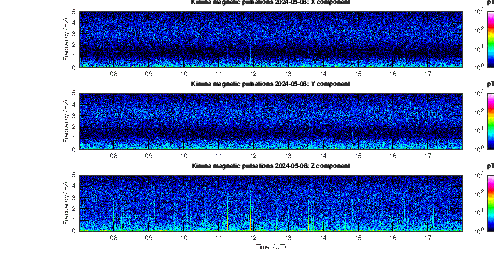
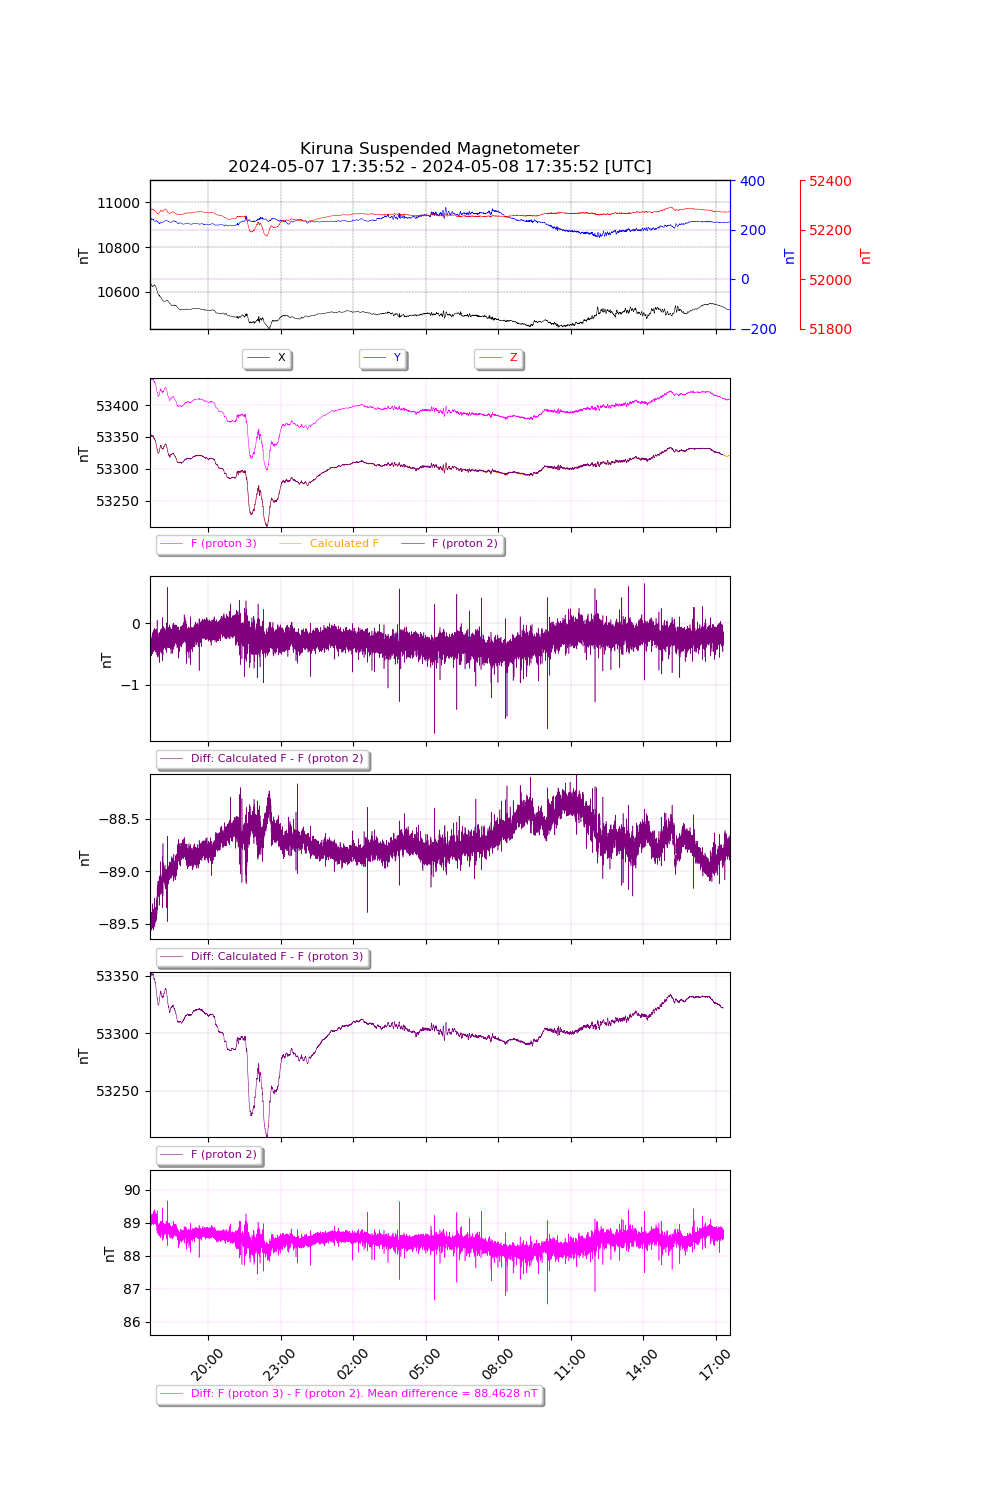
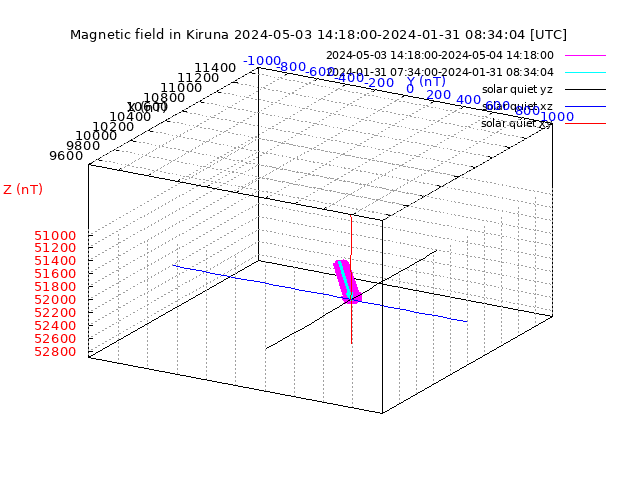
Kiruna (68°N)Data from 2020-12-01. Go to Secondary magnetometer (current backup magnetometer) for data from 1990-01-01. To check K index from 1962 go to K index page. More data can be found here.K-index calculation algorithms: IH = Ingemar Häggström method FMI = Finnish Meteorological Institute method |
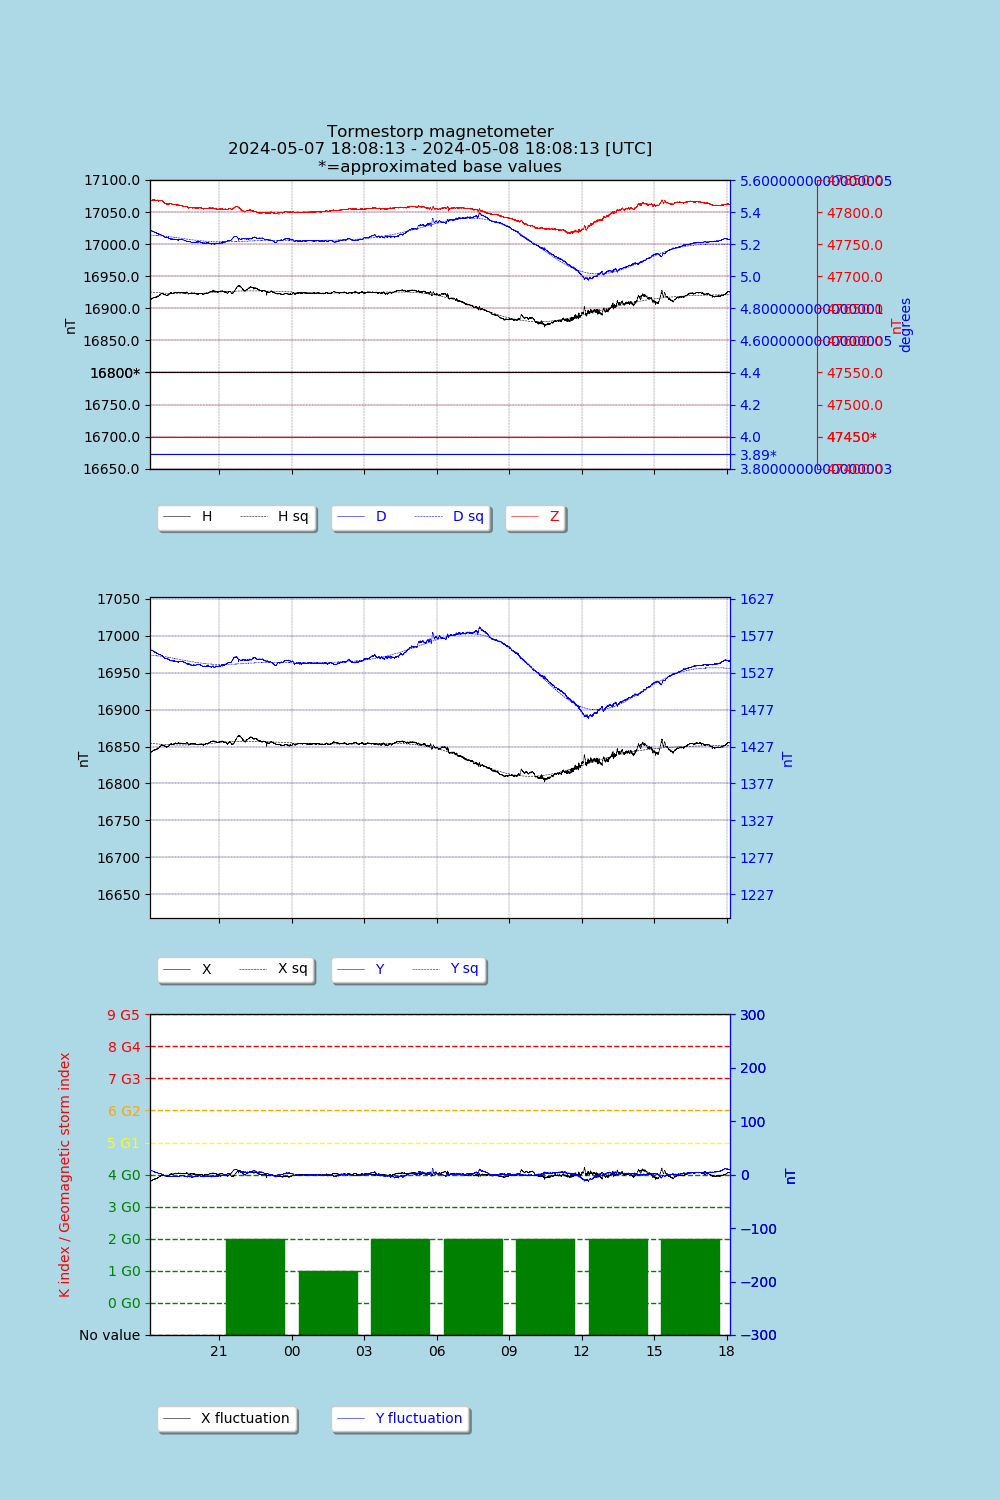
Tormestorp (56°N)Data from 2018-09-19. Archive.Log book Tormestorp 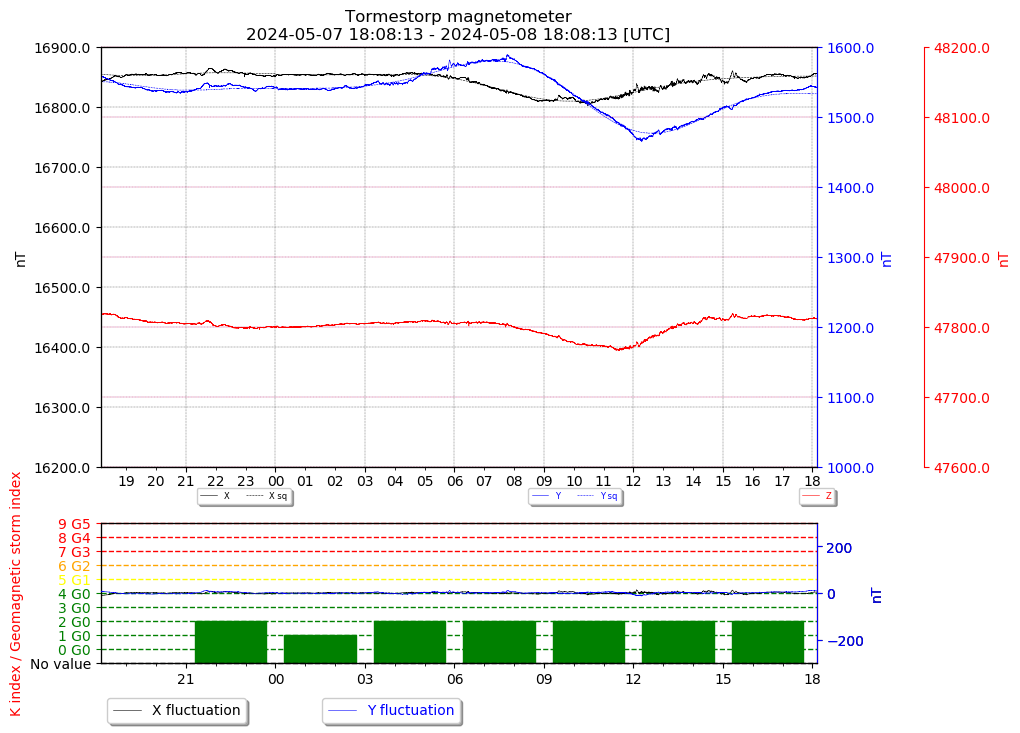
|
||||||||||||||||
|
|||||||||||||||||
|
|
|||||||||||||||||